Horowitz Collection Digital Gallery
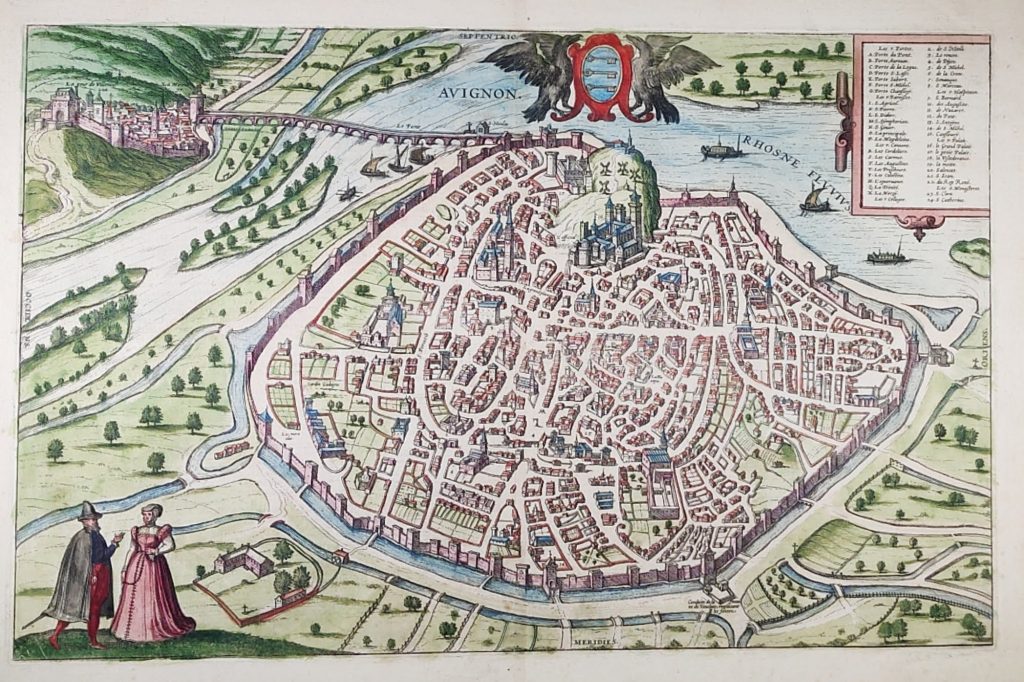
Created by students in “HIST215 – Mapping History,” taught by Prof. Claire Campbell with support from Janine Glathar & Wes Bernstein In Fall 2019, Bucknell alumnus Steven Horowitz ’62…
Part of Library & Information Technology: Supporting technology in research and teaching
Created by students in “HIST215 – Mapping History,” taught by Prof. Claire Campbell with support from Janine Glathar & Wes Bernstein In Fall 2019, Bucknell alumnus Steven Horowitz ’62…
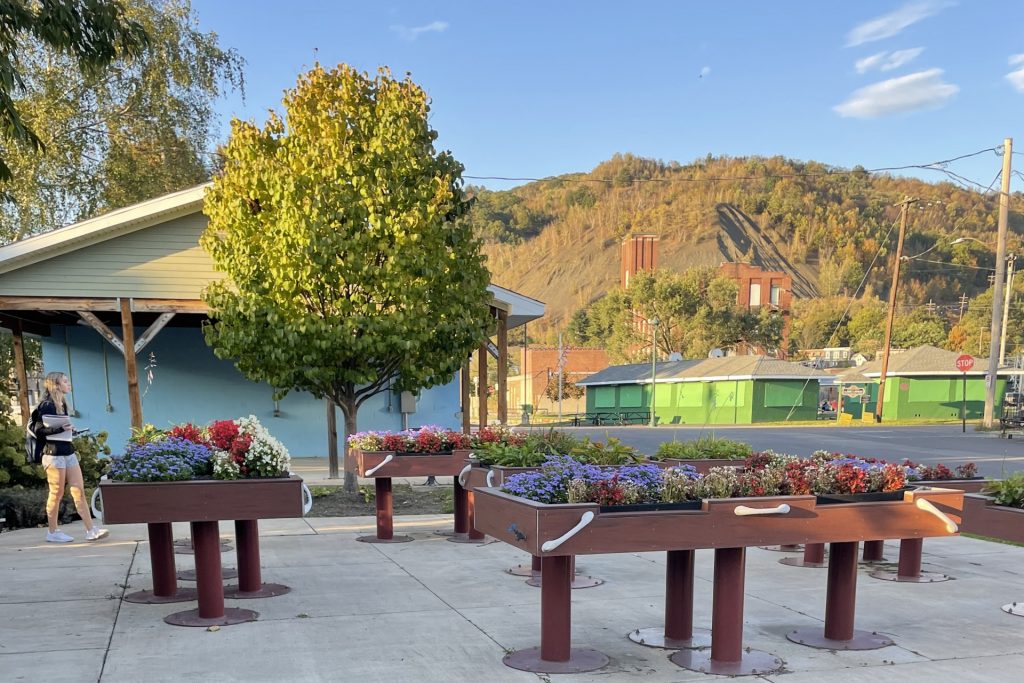
During the spring 2022 semester, Professor Johnathan Favini and students in ENST 210: Environmental Ethnography worked with the Shamokin Creek Restoration Alliance (SCRA) to conduct a…
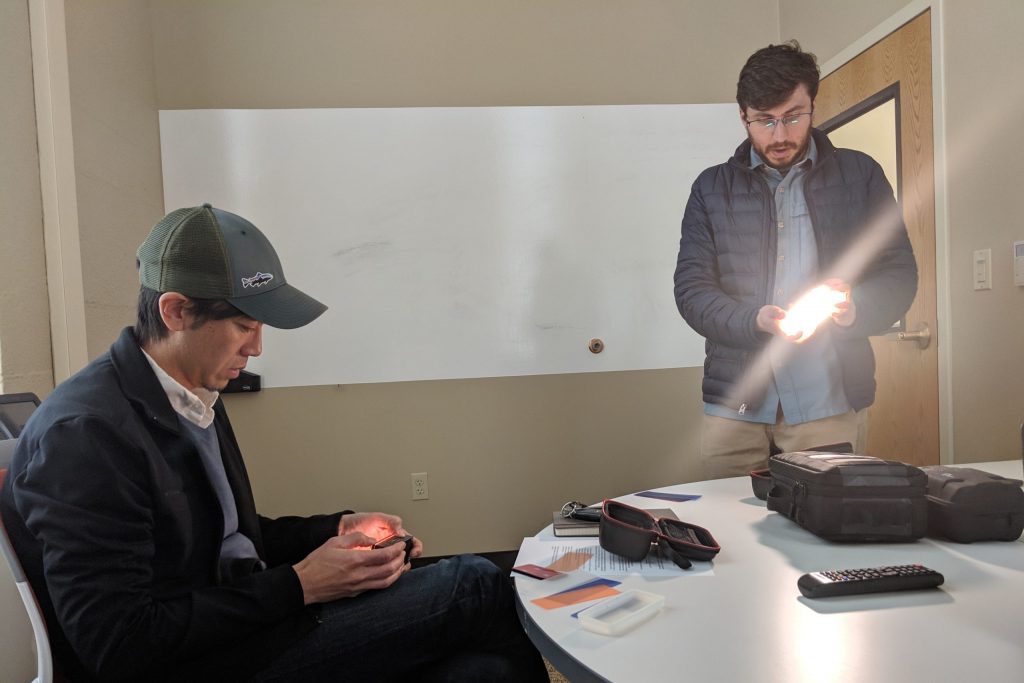
Conservation of Eastern Hellbenders, a large salamander native to the Pennsylvania area, has been the focal point of Dr. Takahashi’s research. However, he also travels to…
Email us at dps@bucknell.edu
The summer digital pedagogy workshop of 2016 was the first event I attended after I arrived at Bucknell, and I was drawn into this wonderful team of dedicated educators immediately.
– Yunjing Xu
Thanks to the training I received in the workshop, I was able to introduce a brand new assignment, digital essays, in two 300-level science seminars I taught.
– Agnes Jasinska
[T]he keynote speakers are stimulating, the sessions enlightening & informative – and the opportunity to hear from students is wonderful – and the atmosphere is collegial & generous.
– BUDSC17 Participant